Average Email Deliverability Rate: 2026 Benchmarks

Canada's 2026 average email deliverability rate is 89.4%, while the latest Canadian inbox placement figure is 86.7%. A good email deliverability rate usually sits above that local average, but the number only helps when you know whether it measures server acceptance or actual inbox placement.
That distinction matters because a message can leave your system, reach a receiving server, and still disappear into spam or quarantine. Canadian senders also face a consent problem, not just a technical one. The CRTC recorded 152,603 spam complaints in one half-year period, and lack of consent appeared in 93% of complaints, according to its official complaint statistics. Authentication helps, but SPF, DKIM, and DMARC can't rescue a list built on weak permission.
What Counts as a Good Deliverability Rate in 2026
The 2026 Canadian average email deliverability rate is 89.4%, according to EmailTooltester's email deliverability statistics. A separate Canadian benchmark found 86.7% inbox placement, while 5.4% of messages entered spam and 7.9% went missing in that sample (Validity's 2025 benchmark report).
These figures describe different checkpoints. Deliverability may mean that a receiving server accepted the message, or that the message reached a visible inbox. One number is like a parcel accepted at the building entrance. The other asks whether it reached the right desk. That difference explains why credible reports can produce different averages.
A practical range for small businesses
Use the figures as a starting point, not a pass-or-fail certificate:
Below 80% inbox placement: Treat this as poor. A large share of your audience is missing the message, even if your platform reports successful delivery.
Around the Canadian average: Your programme may be operating normally, but provider mix, list age, and permission records still need review.
Above the average: This suggests a healthier position when complaints remain low and consent is documented.
Consistently strong placement across providers: This is more useful than one attractive combined score.
The 89.4% figure represents Canadian marketing email overall. It cannot predict your result across every sector, audience, or mailbox provider. Older contacts, inactive subscribers, and people who did not clearly request your emails can pull placement down.
Consent matters alongside authentication. SPF, DKIM, and DMARC help receiving systems identify a sender, but they do not make an unwanted message welcome. A technically authenticated campaign can still perform poorly when its list creates complaints or lacks clear permission.
Practical rule: Compare your provider-level inbox placement with the relevant benchmark, then track your own trend.
A lower result may reflect stale addresses, unclear consent, sudden volume changes, or weak sender identification rather than a fault with your email service. Rescue begins by separating delivery, deliverability, and inbox placement.
Delivery vs Deliverability vs Inbox Placement
Think of email like postal mail. Delivery means the envelope reached the post office serving your recipient. The receiving mail server accepted the message, so your sending platform may mark it as delivered. That result doesn't tell you where the recipient will find it.
Deliverability describes the broader success of the message. Did the receiving system accept it, defer it, filter it, quarantine it, or reject it? In everyday marketing discussions, people often use deliverability to mean the share of messages that reach a visible inbox, although reporting tools don't always use the term consistently.
The three measurements
| Measurement | What it tells you | What it doesn't tell you |
|---|---|---|
| Delivery rate | The receiving server accepted the message | Whether the message reached the primary inbox |
| Deliverability rate | The overall ability to reach the recipient successfully | Which provider or folder caused the loss |
| Inbox placement rate | The share found in the primary inbox rather than spam or quarantine | Whether recipients read or acted on it |
Inbox placement gives you the clearest view of visibility. A message in spam may count as delivered by your email platform, but it hasn't reached the place most recipients check first. A missing message creates a different problem because you may not see an obvious bounce.
Open rate adds another layer of uncertainty. Apple Mail Privacy Protection can load tracking pixels without a person opening the message, while image blocking can prevent a genuine open from being recorded. Outlook image caching can also affect how tracking systems interpret activity. As a result, opens may rise or fall independently of inbox placement.
That doesn't make engagement useless. Clicks, replies, unsubscribes, and complaint signals can help you understand whether your audience values the mail. They shouldn't replace a direct inbox test.
If you can watch only one number, watch inbox placement, not opens.
A seed list helps. You send the same campaign to controlled addresses at several providers, then check where each message appears. This doesn't reproduce every recipient's mailbox settings, but it gives you a practical warning before poor placement becomes a pattern.
Canadian Benchmark Numbers and How They Have Shifted
Verified sources do not provide a complete year-by-year Canadian timeline for 2023, 2024, 2025, and 2026. The 2023 benchmark recorded a 90% average inbox placement rate, with 3.9% of messages placed in spam and 6.1% going missing (Validity's 2023 Email Deliverability Benchmark).
The newer 2025 report recorded 86.7% inbox placement, 5.4% spam placement, and 7.9% missing mail. A separate 2026 Canada-focused summary gives an 89.4% average email deliverability rate. These figures describe related, but not necessarily identical, populations and measurements.
| Year | Verified Canadian figure | What it measures | Source context |
|---|---|---|---|
| 2023 | 90% inbox placement | Average inbox placement | Validity benchmark |
| 2025 | 86.7% inbox placement | Overall inbox placement | Validity benchmark |
| 2026 | 89.4% deliverability | Canada-focused average deliverability | EmailTooltester summary |
The change should not be treated as a smooth annual trend. Samples, mailbox-provider mixes, and definitions can all move the result. A 2023 inbox-placement figure cannot be compared directly with a 2026 deliverability figure.
Why the benchmark moves
Mailbox providers assess several signals at once. Authentication helps prove that a message belongs to your domain, but it cannot repair a list built on weak consent. Recipient engagement, complaints, sending patterns, and message content also influence placement.
Canadian programmes often perform well when they use double opt-in. The subscriber confirms control of the address, which filters out mistyped or unwanted sign-ups and supports a healthier list, as noted in the 2023 Validity benchmark report.
Consent also has a trust and compliance dimension in Canada. A technically authenticated message can still produce poor results if recipients did not expect it, ignore it, or report it. CASL enforcement therefore matters to deliverability as well as legal risk, because unwanted mail can create the complaint signals mailbox providers use when judging a sender.
Provider mix changes the average too. A list weighted toward Gmail may produce a different result from one weighted toward Microsoft mailboxes. Sector, consent process, and audience activity add more variation, so use benchmarks as reference points rather than guarantees.
For infrastructure context, read this guide to evaluating Canadian email hosting providers. It separates hosting choices from the reputation and consent work your sending programme still requires.
How Mailbox Providers Affect Your Numbers
A single deliverability average can conceal a major provider-specific gap. The 2025 Canadian benchmark recorded 94.4% inbox placement at Gmail, 78.9% at Microsoft, 88.6% at Yahoo/AOL, 82.9% at Apple, and 91.8% at Shaw, as reported in Validity's 2025 benchmark report.
Those figures describe inbox placement, not every possible outcome. The report does not provide verified spam-folder and missing percentages for each provider, so those fields should not be filled with estimates.
| Mailbox provider | Inbox placement, Canada, 2025 | Spam folder % | Missing % | What the gap means |
|---|---|---|---|---|
| Gmail | 94.4% | Not reported in verified data | Not reported in verified data | Strong placement still depends on engagement and consent |
| Microsoft | 78.9% | Not reported in verified data | Not reported in verified data | Stricter bulk filtering and reputation signals may affect results |
| Yahoo/AOL | 88.6% | Not reported in verified data | Not reported in verified data | Authentication and complaint control remain important |
| Apple | 82.9% | Not reported in verified data | Not reported in verified data | Privacy features make open tracking less dependable |
| Shaw | 91.8% | Not reported in verified data | Not reported in verified data | Local provider mix can change the aggregate result |
Your total rate is an average across the mailboxes your subscribers use. A campaign can perform well at Gmail while struggling overall because a large part of the audience uses Microsoft or Apple. That difference reflects separate reputation models, filtering rules, and recipient signals, not necessarily a reporting error.
Provider behaviour also changes how you interpret campaign data. Gmail places substantial weight on engagement. Microsoft may apply firm controls to bulk traffic. Yahoo and AOL rely on authentication and sender reputation. Apple's Mail Privacy Protection makes open rates less dependable, so placement and clicks provide a clearer view of response.
Consent still sits underneath these technical differences. A valid authentication setup can identify your sending domain, but it cannot create trust with recipients who did not expect the message. In Canada, permission and complaint patterns can affect both compliance risk and the signals mailbox providers use.
Provider check: Separate placement by mailbox provider before changing subject lines or rebuilding a campaign.
Email must first reach the correct receiving system. For the infrastructure layer, read this guide to how MX records route email. Correct routing gets a message to the provider, while filtering determines whether recipients can see it in the inbox.
What Actually Drags Your Deliverability Down
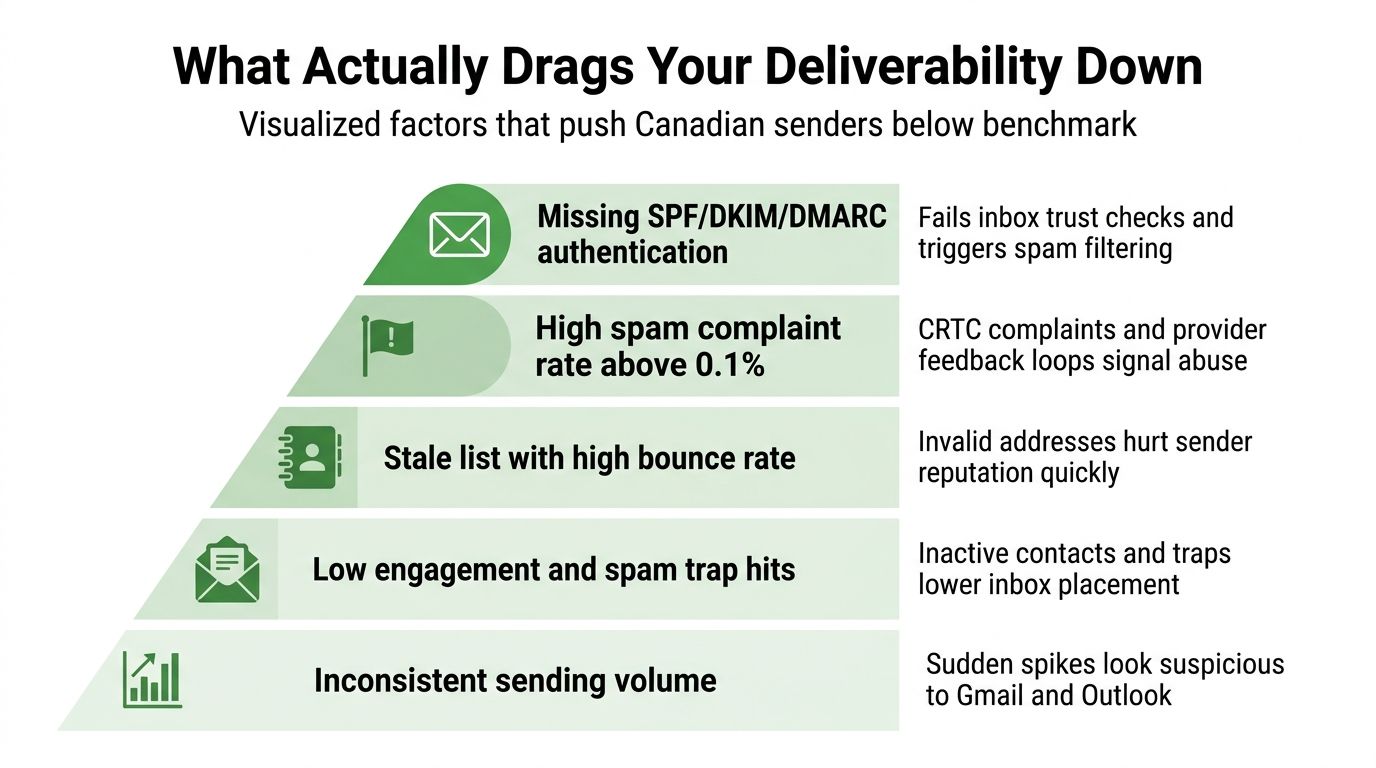
Technical authentication sits near the beginning of the process, but it isn't the whole process. The CRTC complaint data points to a broader trust issue. If recipients didn't consent, your domain may authenticate perfectly and still attract complaints, unsubscribes, filtering, and enforcement attention.
Fix permission before polishing content
SPF, the Sender Policy Framework, tells receiving servers which systems may send for your domain. DKIM, or DomainKeys Identified Mail, adds a cryptographic signature to help prove that the message wasn't altered. DMARC, Domain-based Message Authentication, Reporting, and Conformance, lets the receiving server compare those signals with the visible From domain and report failures.
Misaligned or missing records can trigger spam placement, deferrals, or rejection. They deserve attention early, but authentication cannot turn a purchased list into a permission-based list.
CASL, Canada's anti-spam law, makes consent and sender identification central responsibilities. The CRTC reported 152,603 complaints in one half-year period, and 93% cited lack of consent (CRTC CASL compliance and complaint information). That evidence makes list origin a higher-priority question than many generic deliverability checklists suggest.
Match symptoms to likely causes
Spam placement: Often follows weak engagement, high complaint activity, unclear sender identity, or authentication problems.
Deferrals: Can appear when a provider slows traffic because volume, reputation, or sending patterns look risky.
Hard bounces: Usually point to invalid or abandoned addresses. Repeated bounces damage your sender reputation.
Blocks: May follow repeated complaints, poor list quality, suspicious volume, or failed authentication.
Engagement collapse: A re-engagement campaign can expose how many contacts no longer recognise or want your messages.
Old addresses, role accounts, shared lists, and implicit permission all increase risk. A clear subject line helps recipients understand the message, but a clever subject line won't repair a list that people never agreed to join.
The highest-priority order is simple. Confirm consent, remove risky contacts, authenticate the domain, and then examine content and volume. If you reverse that order, you may spend time testing copy while the underlying trust problem continues.
How to Measure Deliverability the Right Way
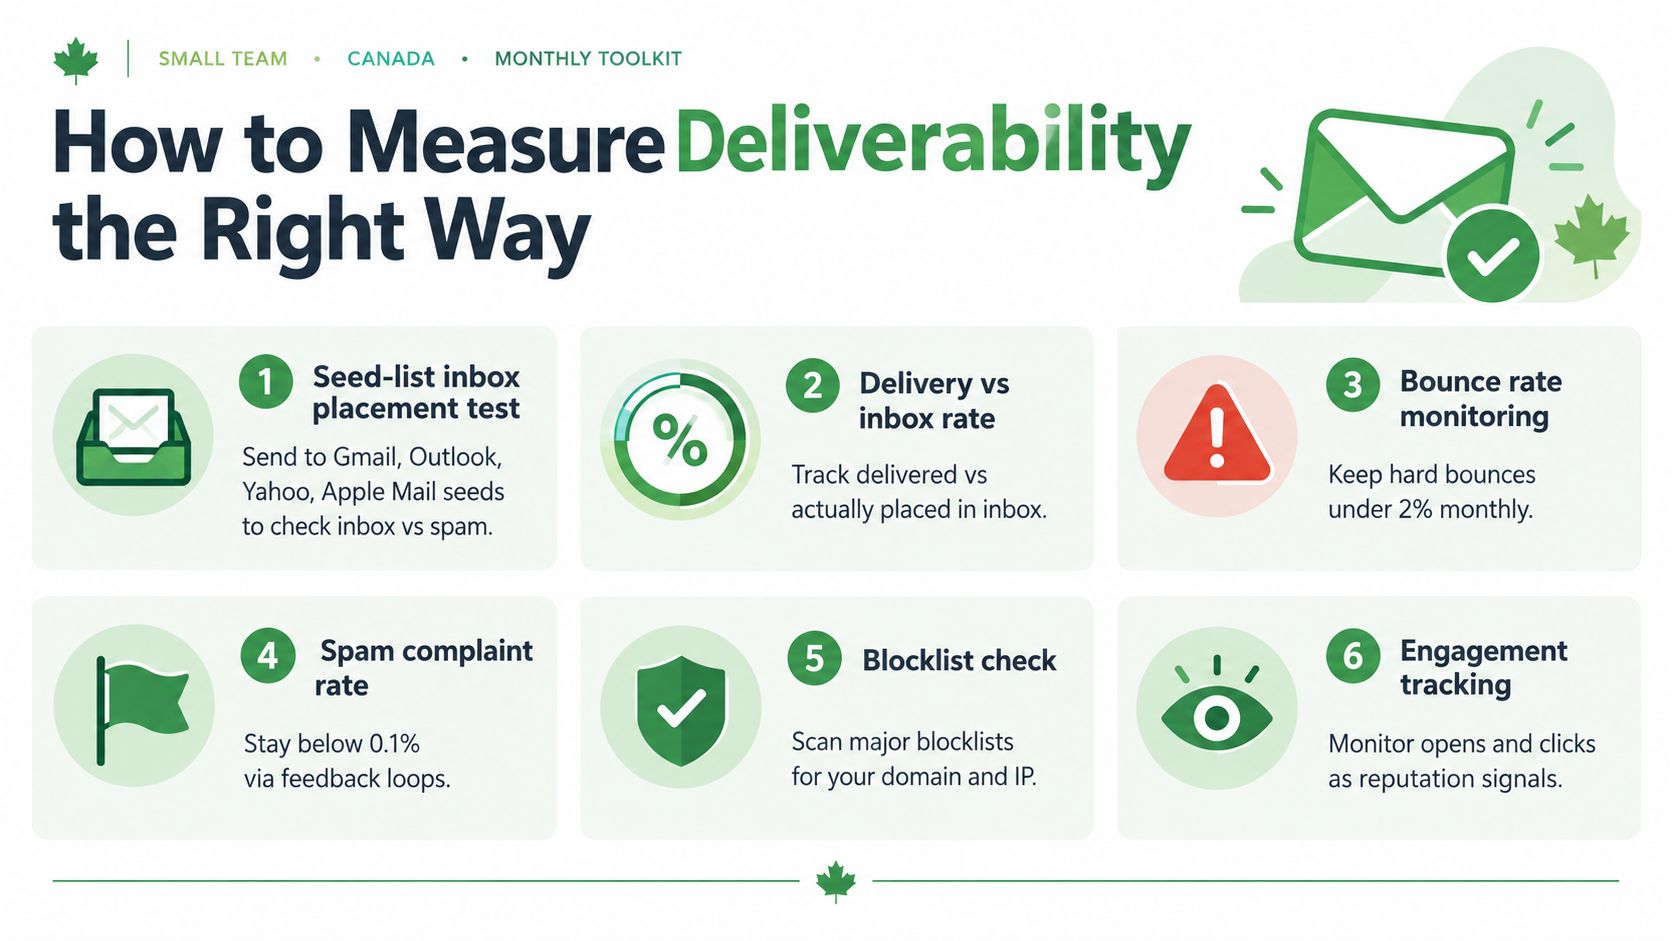
A small team can build a useful measurement routine without enterprise software. Start with a controlled seed list, which contains addresses you own at Gmail, Outlook, Yahoo, and Apple Mail or iCloud. Send a test campaign, then check inbox, spam, quarantine, and missing status after the campaign has had time to process.
Build a repeatable review
Run a seed test on each important send. Use an inbox placement service such as Validity, Inboxalytics, or a comparable tool when you need trend tracking across campaigns. The value comes from comparing the same providers over time, not from treating one test as a permanent score.
Google Postmaster Tools can help you review domain and IP reputation for eligible traffic. Microsoft SNDS provides information about outbound traffic sent to Outlook systems. These tools won't explain every individual filtering decision, but they can reveal whether a provider sees a broader reputation problem.
DMARC aggregate reports add another useful view. They show which systems send mail claiming to use your domain and whether authentication aligns. Review them for unexpected senders, spoofing, and configuration failures.
Use a calendar, not guesswork
Each send: Check seed-list placement and delivery errors.
Weekly: Review complaint feedback loops where available, including Outlook, Yahoo, and relevant industry programmes.
Monthly: Compare provider reputation, bounces, clicks, unsubscribes, and placement.
Quarterly: Audit SPF, DKIM, DMARC alignment, vendors, and consent records.
Twice yearly: Run a full inbox-placement benchmark across your main providers.
Measurement principle: Open rate can help explain engagement, but it shouldn't be your primary deliverability metric.
Apple Mail Privacy Protection makes open data less precise, and image caching affects other mailbox reports. For a practical blacklist workflow, use our guide to checking and restoring email deliverability. A consistent record will show whether a problem affects one provider or your whole programme.
A Step by Step Plan to Improve Your Rate
Improvement works best when you fix trust before increasing volume. Follow the sequence below, and keep records so you can connect each change with later placement results.
Start with permission. Document where each contact came from and whether the person gave express consent. Remove addresses you can't support with a credible consent record, especially purchased or shared-list contacts. Add a clear unsubscribe path and identify your organisation in every marketing message.
Authenticate your sending domain. Configure SPF and DKIM, then publish DMARC so receiving providers can evaluate alignment. Begin with a monitoring approach while you review reports, rather than switching to a strict enforcement policy before you know which legitimate services send on your behalf.
Clean the list. Suppress hard bounces, invalid addresses, dormant role accounts, and contacts who repeatedly ignore your mail. Spam traps often resemble abandoned addresses, so buying lists or recycling old databases creates unnecessary risk.
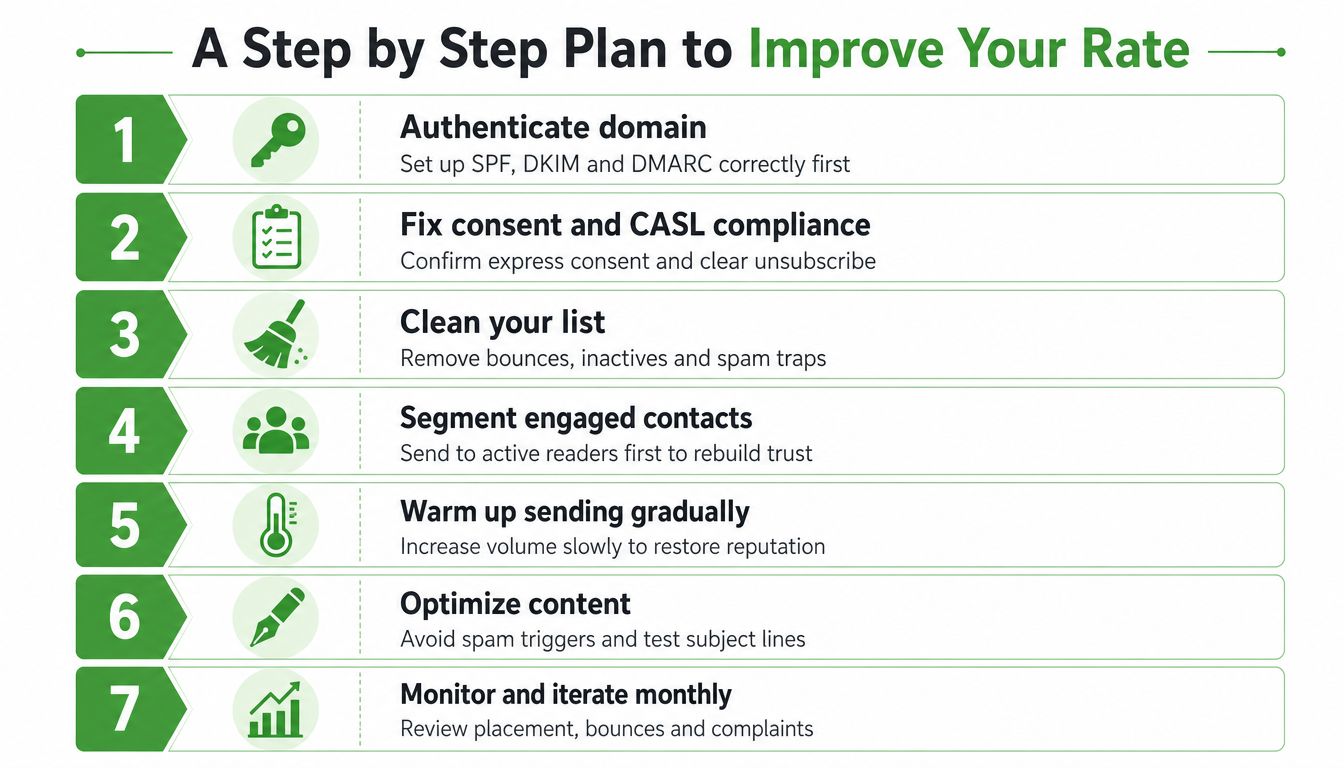
Segment engaged readers. Send your next important campaign to people who recently clicked, replied, or otherwise showed interest. Separate inactive contacts instead of allowing them to determine your main sending pattern.
Increase volume gradually. New sending infrastructure needs a measured ramp-up. Sudden spikes can look suspicious to Gmail and Outlook, particularly when recipients don't interact with the messages.
Make the message recognisable. Use a clear From name, honest subject line, expected branding, and a useful reason to open. Include one-click unsubscribe headers where your platform supports them, and follow the current requirements that apply to your recipients and sending volume. Don't hide the opt-out link in small text.
Review and adjust. Compare seed placement, provider reputation, bounces, complaints, clicks, and DMARC reports. If one provider falls while others remain stable, investigate that provider's traffic and audience segment before making broad changes.
A weekly review catches sudden placement changes. A monthly review helps you remove inactive contacts and validate complaint signals. A quarterly authentication and consent audit keeps technical settings aligned with the tools your business uses.
Typewire is one Canadian email option for teams that want ad-free hosting, custom domains, Canadian data residency, and infrastructure operated in Vancouver. Those hosting choices can simplify control over your mailbox environment, but any marketing sender still needs proper consent, authentication, and list hygiene.
Common Questions About Email Deliverability
What's considered a good email deliverability rate?
Above 85% inbox placement is generally considered good. The 2026 Canadian average is 89.4%. However, a "good" rate depends on your industry, list age, and provider mix. Gmail averages 94.4% inbox placement in Canada, while Microsoft averages 78.9%, so segment your results by provider rather than relying on a single number.
What's the difference between deliverability rate and inbox placement rate?
Deliverability rate measures whether a receiving server accepts your message (accepted, deferred, filtered, quarantined, or rejected). Inbox placement rate measures specifically whether the message reached the primary inbox rather than spam or quarantine. Inbox placement is the more practical metric for marketing.
Why is my deliverability rate lower than the Canadian benchmark?
Common causes include weak consent records (93% of CASL complaints cite lack of consent), poor authentication (missing or misaligned SPF/DKIM/DMARC), stale email addresses, high complaint rates, or sudden volume changes. Start by auditing your consent records before adjusting content or authentication.
How often should I test my email deliverability?
Run a seed-list test on each important send, review complaint feedback weekly, audit placement and reputation monthly, and conduct a full authentication audit quarterly. A twice-yearly benchmark across major providers (Gmail, Microsoft, Yahoo, Apple) helps you spot trends.
Why is Microsoft inbox placement lower than Gmail in Canada?
Microsoft applies stricter bulk filtering and reputation monitoring than Gmail. Factors that affect Microsoft placement include sender reputation, authentication alignment, complaint rates, and engagement patterns. Segment your testing by provider to see if Microsoft shows different behaviour than Gmail or Yahoo.
Does authentication (SPF, DKIM, DMARC) guarantee good inbox placement?
No. Authentication helps receiving systems verify your domain, but it cannot repair weak consent or poor list quality. A technically perfect DMARC setup can still produce poor placement if recipients didn't expect the message or if complaints are high. Fix permission before polishing authentication.
If you want private, ad-free email hosted in Canada, visit Typewire to review custom-domain plans, encrypted mail, and support for migration. Choose the setup that fits your business, then apply the same consent and authentication discipline to protect inbox placement.
Average Email Deliverability Rate: 2026 Benchmarks
Posted: 2026-09-18
Phishing vs Spam: What’s the Difference?
Posted: 2026-09-15
PIPEDA vs GDPR Key Differences for Businesses
Posted: 2026-09-11
CASL Express vs Implied Consent: What’s the Difference?
Posted: 2026-09-08
Moving Away from Big Tech Email and How to Make the Transition Smooth. Here’s How:
Posted: 2026-09-04
Why Choose Typewire as a Canadian Email Option
Posted: 2026-09-01
What Happens if You Open a Phishing Email?
Posted: 2026-08-28
How to Evaluate Canadian Email Hosting Providers (2026 Guide)
Posted: 2026-08-25
What Is DKIM Record and How Email Signing Works
Posted: 2026-08-21